Piercing Pattern Candlestick: A Simple Guide for Everyday Traders
If you've ever stared at a stock chart full of red and green candles wondering what they mean, you're not alone. Among the many candlestick formations traders look for, one pattern stands out as a beacon of hope in a falling market — the piercing pattern candlestick.
It’s like spotting sunlight after a storm, signaling that bearish pressure may soon give way to bullish energy. But what exactly is this pattern, and how can you use it in your trading journey? Let’s explore this in plain English, step by step.
Learn about piercing pattern candlestick, piercing line pattern, and top trading courses in India to master profitable trading strategies effectively.
Introduction to Candlestick Patterns
Candlestick charts are the lifeblood of trading. They help traders visualize price movements easily. Each candlestick shows four data points — open, high, low, and close — packed into one shape.
Think of a candle as a mini story about market emotions during a specific time period. When several candles form recognizable shapes, those patterns tell us who’s winning — buyers or sellers.
One such pattern is the piercing line pattern, a well-known bullish reversal signal that every trader should recognize.
What Is a Piercing Pattern Candlestick?
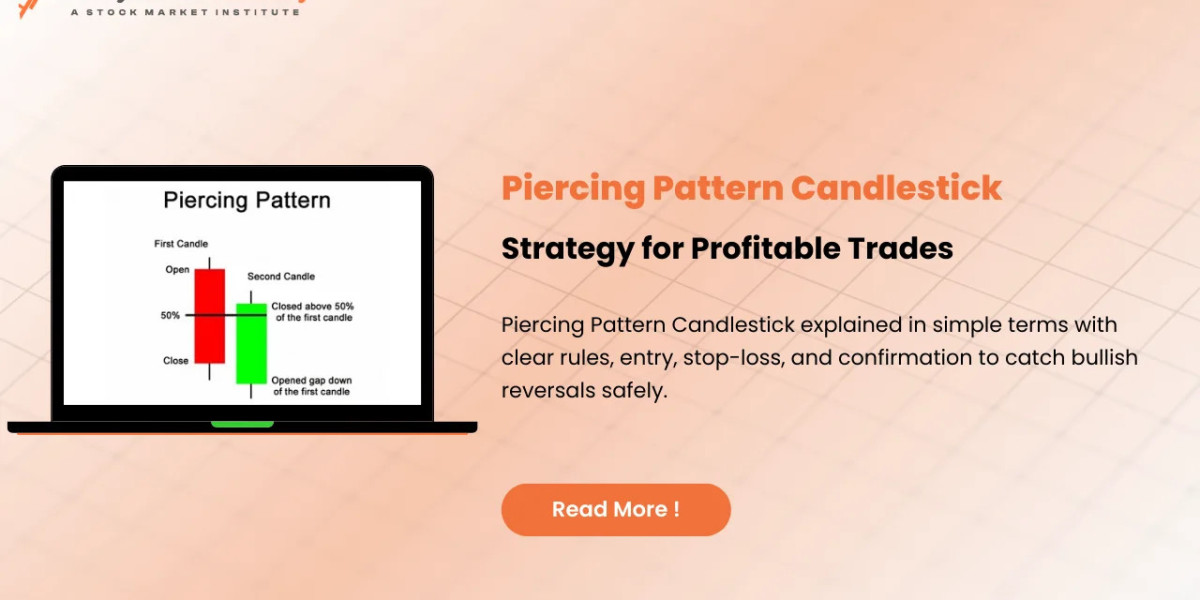
The piercing pattern candlestick appears at the end of a downtrend, signaling a potential trend reversal. It consists of two candles:
The first candle is bearish (red or black), showing continued selling pressure.
The second candle opens below the previous low but closes above the midpoint of the first candle’s body.
This sudden shift shows that buyers are stepping in powerfully after a period of heavy selling. It’s like a plot twist in a movie — when you least expect it, the heroes (bulls) fight back.
Anatomy of the Piercing Pattern
Let’s break down the structure of this pattern:
Candle 1 (Bearish Candle): Represents sellers dominating the session.
Candle 2 (Bullish Candle): Opens lower but closes strong, crossing more than 50% of the previous body.
Market Context: Appears near support levels or after an extended downtrend.
When you see this setup, it’s a sign that sellers may be losing strength and buyers might soon take control.
Psychology Behind the Pattern
Trading psychology plays a vital role here. The piercing line pattern reveals a clear emotional swap between fear and confidence.
The first red candle creates panic — many traders sell in anticipation of lower prices.
However, the next morning, buyers arrive and push the price higher than expected.
This “pierces” the bearish sentiment, hence the name piercing pattern.
In simpler terms, it’s like watching the tide turn: the sellers have drained their energy, and buyers rush in with renewed vigor.
Piercing Line Pattern vs Other Reversal Patterns
How does the piercing pattern compare to other reversal setups? Let’s look briefly:
Pattern | Type | Key Feature |
Piercing Pattern | Bullish | Second candle closes above midpoint of previous one |
Bullish Engulfing | Bullish | Entire second candle engulfs the previous one |
Morning Star | Bullish | Three-candle formation showing gradual shift |
Hammer | Bullish | Single candle with long lower wick |
The piercing pattern is slightly less powerful than the engulfing pattern but more significant than a single candle like the hammer.
How to Identify a Piercing Line Pattern
To spot this setup accurately, look for:
Clear Downtrend: Must precede the pattern.
First Candle: Strong bearish momentum.
Second Candle: Opens lower but closes beyond the midpoint of the first candle.
Confirmation Candle (Optional): Third candle that continues upward action.
When all these align, you’ve got a classic piercing line pattern — a good signal for potential trend reversal.
Key Rules to Confirm the Piercing Pattern
Before acting on the pattern, confirm it using these simple rules:
Check volume — higher on the bullish candle is preferred.
Look for support zones or Fibonacci retracement levels nearby.
Avoid trading just based on one candle pair. Always consider market context.
Wait for a confirmation candle for safer entry.
By following these checks, you’ll avoid traps and reduce false signals.
Common Mistakes Traders Make
Traders, especially beginners, often misinterpret candlestick formations. Here are common pitfalls:
Ignoring the overall trend direction.
Entering trades too early without confirmation.
Using the pattern in sideways markets where it loses reliability.
Neglecting stop-loss orders.
Avoiding these mistakes is like wearing a seatbelt — it won’t stop accidents, but it will minimize the damage.
Example of Piercing Pattern in Real Charts
Let’s take an example from a stock like Tata Motors or Infosys.
Imagine a steady decline over five sessions. On the sixth day, the stock opens lower, forming another red candle. But by the closing bell, buyers push the price up past half of yesterday’s red candle.
That’s your piercing pattern. What follows often is a reversal or at least a temporary relief rally.
For verification, traders use platforms like TradingView or Investing.com to back-test piercing setups visually.
Best Timeframes to Use the Piercing Pattern
While candlestick patterns can appear on any chart, the timeframe determines their reliability.
Daily chart: More trustworthy and suitable for swing traders.
4-hour or hourly chart: Useful for intraday trading.
Weekly chart: Valid for long-term position traders.
The key idea is — the higher the timeframe, the stronger the signal.
Combining Piercing Pattern with Technical Indicators
Candlestick patterns alone aren’t enough for consistent success. Smart traders combine them with indicators such as:
Relative Strength Index (RSI): A reading below 30 followed by a piercing pattern strengthens the signal.
Moving Averages: If the pattern forms near the 50-day MA, expect stronger reversals.
MACD: Bullish crossovers after a piercing pattern add confidence.
This combination acts like having multiple safety nets before taking a leap.
Risk Management with Piercing Candlestick Setup
Even accurate setups can fail. To manage your risk:
Set stop-loss just below the second candle’s low.
Use 1:2 risk-reward ratio for trades.
Don’t over-leverage your capital.
Think of risk management as your trading insurance policy — boring but essential.
Piercing Pattern in Forex and Stock Market
While the pattern works in both markets, context differs slightly:
In Forex trading, where liquidity is high, confirmation through indicators is crucial.
In stocks, especially Indian markets, emotional retail participation often makes piercing patterns more frequent and visible.
No matter the asset — equities, commodities, or crypto — price action psychology remains universal.
Trading Courses in India to Learn Candlestick Patterns
If you’re serious about mastering such setups, several trading courses in India teach candlestick trading strategies in depth.
Top options include:
NSE Academy Certified Technical Analysis Course
IFMC Institute Online Trading Course
Zerodha Varsity (Free Learning Platform)
StockDaddy and Trendy Traders Academy (Great for beginners)
These courses help you interpret patterns with confidence, back-test strategies, and apply professional-level discipline.
Conclusion
The piercing pattern candlestick might look simple, but it holds a wealth of information about market sentiment. It’s an early sign that bears are losing their grip and bulls are preparing to take charge.
By combining it with technical indicators, sound risk management, and a proper education through trading courses in India, you can enhance your timing and confidence in the markets.
Think of it as learning to read the market’s language — once you understand its grammar, you can anticipate its stories better than ever.
FAQs
1. What does a piercing pattern candlestick indicate?
It signals a potential bullish reversal after a downtrend, where buying momentum starts to overpower selling pressure.
2. Is the piercing line pattern reliable for intraday trading?
Yes, but confirmation from volume or indicators like RSI strengthens its reliability in shorter timeframes.
3. How is the piercing pattern different from the bullish engulfing pattern?
In a bullish engulfing pattern, the second candle completely covers the previous one, while in a piercing pattern, it only crosses above the midpoint.
4. Which indicators work best with the piercing pattern?
RSI, MACD, and moving averages are among the most useful indicators to confirm piercing setups.
5. Where can I learn piercing pattern trading in India?
You can explore NSE Academy, Zerodha Varsity, IFMC Institute, or Trendy Traders Academy for structured trading courses in India.